Characterizing syntax analyses with graph metrics
Once we have analyzed a passage, we can characterize the resulting syntax graph with standard graph metrics. arsgrammatica includes functions for analyzing graphs in Python, and a Marimo notebook, latin_syntaxer_graphs.py, where you can interactively explore some of these metrics.
Finding graph metrics
First, from a token graph, we create a graph in the format of the Python NetworkX package:
from arsgrammatica import tokengraph_to_networkx, graph_metrics
nxgraph, warnings = tokengraph_to_networkx(tokengraph)
We can compute graph metrics directly from the NetworkX graph:
metrics = graph_metrics(nxgraph)The resulting variable metrics has a number of properties that can help us understand the size, complexity, and “shape” of the syntax analysis’ graph structure.
Size
node_count and edge_count properties tell us the number of tokens and the number of relations connecting tokens in our syntax graph. If the graph is not cyclic, longest_chain tells us the deepest level of token relations in the sentence. longest_chain is None when a a graph includes a cycle.
If we analyzed an artificial sentence like Rosa pulchra est, we could visualize the graph like this:
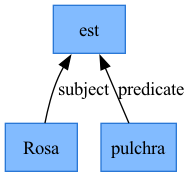
It has a node count of 3, edge count of 2, and a longest chain of 1.
“Shape” (topology)
leaf_count tells you the number of tokens that no other tokens depend on (the “leaves” in a tree visiualization). leaf_fraction gives you the proportion of nodes in the graph that are leaf nodes. In the toy example, two nodes are leaf nodes (Rosa and pulchra), and the leaf fraction is 67% (2/3).
The example syntax graph is a tree: every node is connected and there are no cycles or loops in the graph. Most syntax graphs come close to a tree structure, but tokens like relative pronouns (that are related both to their antecedent and to their function in the relative clause) can create cycles. The cyclomatic_number gives a measure of “how much non-tree structure does this sentence have?” (More techncially, it gives the number edges beyond a spanning tree, computed as edge_count - node_count + weakly_connected_components). The cyclomatic number in the example is 0, because the entire graph is a true tree.
Organization of the graph
arsgrammatica’s syntax graphs are directed: pairs of nodes are connected from one node to another (e.g., the subject relationship makes a connection from a subject to its verb). For any node, the in-degree is the number of relations point to it, and the out-degree is the number of relations it points out to. In the example above, est has an in-degree of 2, and an out-degree of 0.
The mean_dependents and max_dependents measure the average and maximum in-degree of the graph. If a sentence has a high maximum compare to its node count, that tells us one token controls most of the syntax. Lower values with mean and maximum closer to each other suggests a “shallow and bushy” structure rather than a “deep and chainy” organization.
Real examples
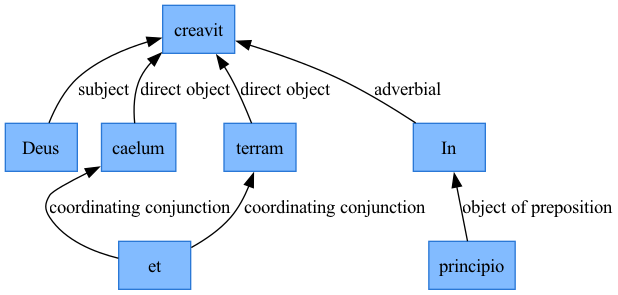
To illustrate how graph metrics can describe syntax, compare the toy example with two sentences from the Latin Vulgate Bible. Genesis 1.1, In principio creavit Deus caelum et terram. is a syntactically straightforward sentence with a single verbal unit:
Genesis 47.1 is much more complex syntactically: circumstantial participles include dicens introducing two clauses in direct speech.
Ingressus ergo Joseph nuntiavit Pharaoni, dicens: Pater meus et fratres, oves eorum et armenta, et cuncta quae possident, venerunt de terra Chanaan: et ecce consistunt in terra Gessen.
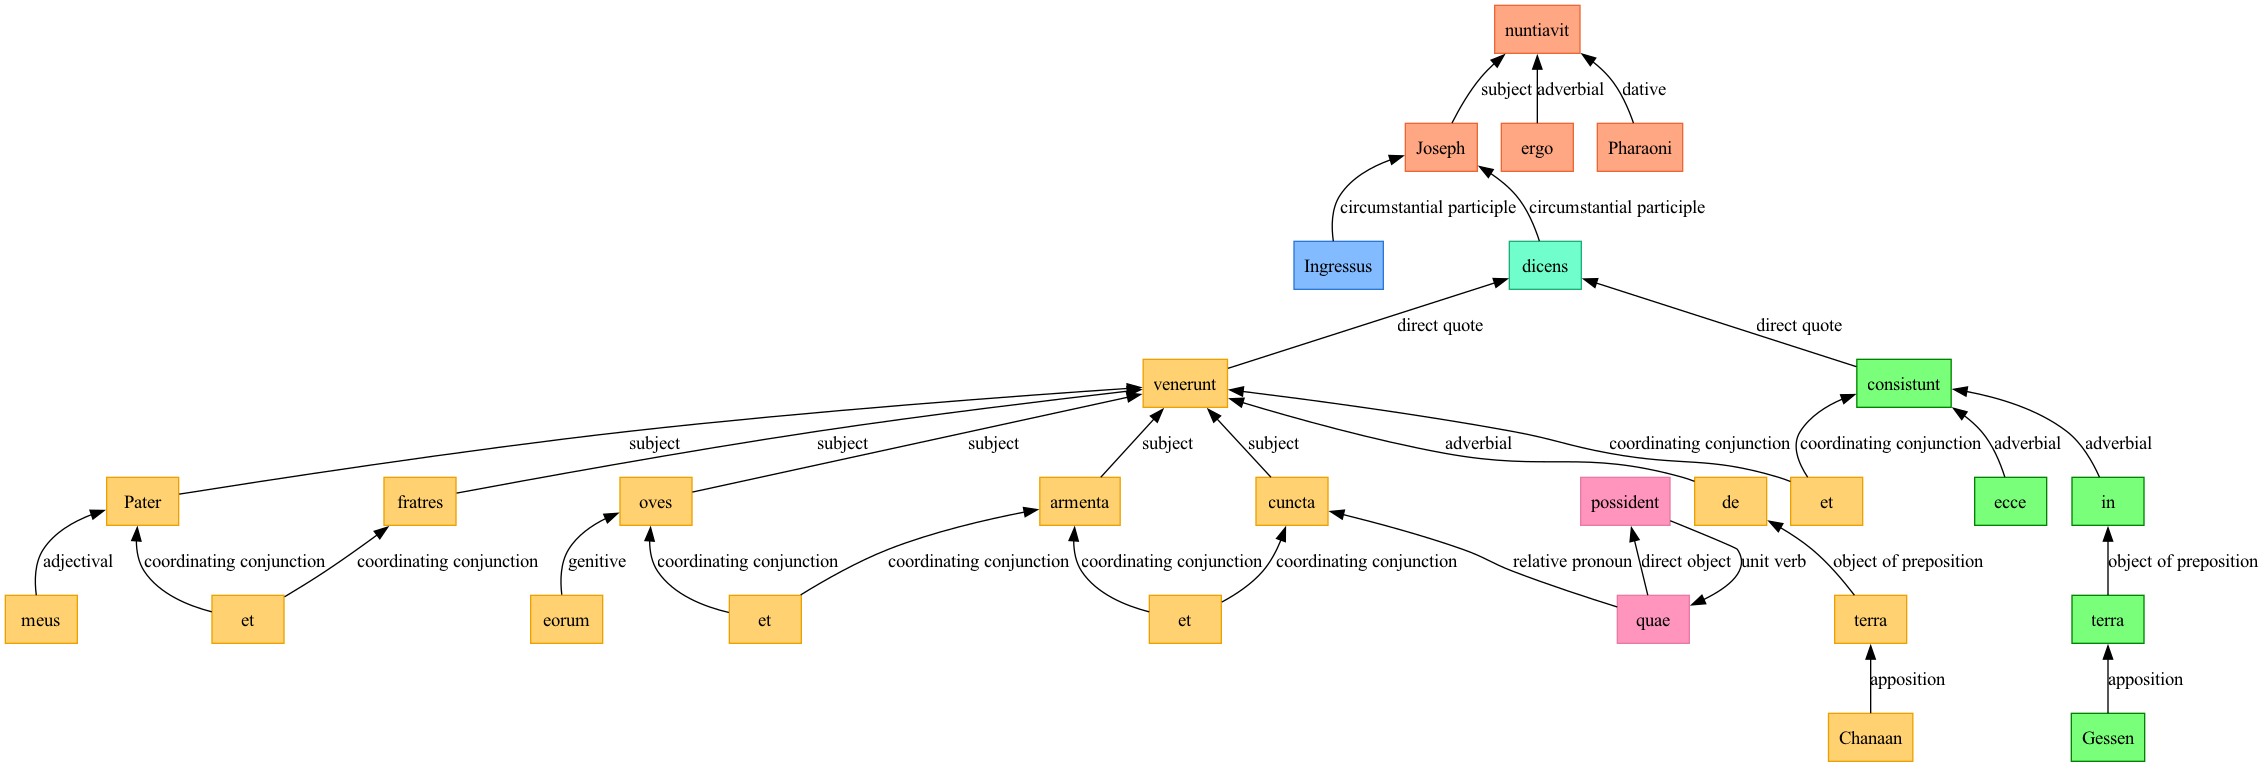
If the diagram is too small to read, open it in a separate browser tab or window to enlarge it.
Here are the metrics for each example:
| metric | Example | Genesis 1.1 | Genesis 47.1 |
|---|---|---|---|
| node count | 3 | 7 | 54 |
| edge count | 2 | 7 | 59 |
| cyclomatic number | 0 | 1 | 8 |
| longest chain | 1 | 2 | - |
| leaf count | 2 | 3 | 21 |
| leaf fraction | 67% | 43% | 39% |
| mean dependents | 0.67 | 1.0 | 4 |
| max dependents | 2 | 1.09 | 7 |
Finally we should note that the output of graph_metrics also has a relationship_counts property. This property is a dictionary giving the counts of each value of relationship. Here is what the relationship_counts property looks like for Genesis 1.1:
{'adverbial': 1, 'object of preposition': 1, 'subject': 1, 'direct object': 2, 'coordinating conjunction': 2}and for Genesis 47.1:
{'circumstantial participle': 2, 'adverbial': 6, 'subject': 8, 'dative': 1, 'adjectival': 6, 'coordinating conjunction': 12, 'genitive': 4, 'relative pronoun': 2, 'direct object': 4, 'unit verb': 2, 'direct quote': 4, 'object of preposition': 3, 'apposition': 4, 'predicate': 1}latin_syntaxer_graphs.py
With the latin_syntaxer_graphs.py marimo notebook, you can apply these graph metrics to saved analyses. The user picks one or more sentences to analayze, and the compiles tables comparing their metrics.