Graph visualization and metrics with Gephi
In your second collaborative notebook, you created a social network, and saved a representation of the network in a file on your computer in DOT format.
For Monday, test the validity of your DOT file by opening it in Gephi. If you import is successful, you will see a summary screen that reports the type of graph (directed or undirected), and the number of nodes and edges in the graph. Take a screen shot, and submit this image to your folder on the course Google Drive.
For example, if I author a tiny graph like this by hand in DOT format:
graph gods {
    Zeus -- Hera
    Hera -- Athena
    Zeus -- Athena
    Zeus -- Apollo
    Apollo -- Artemis
    Apollo -- Athena
}
when I open the file in Gephi, I see this summary:
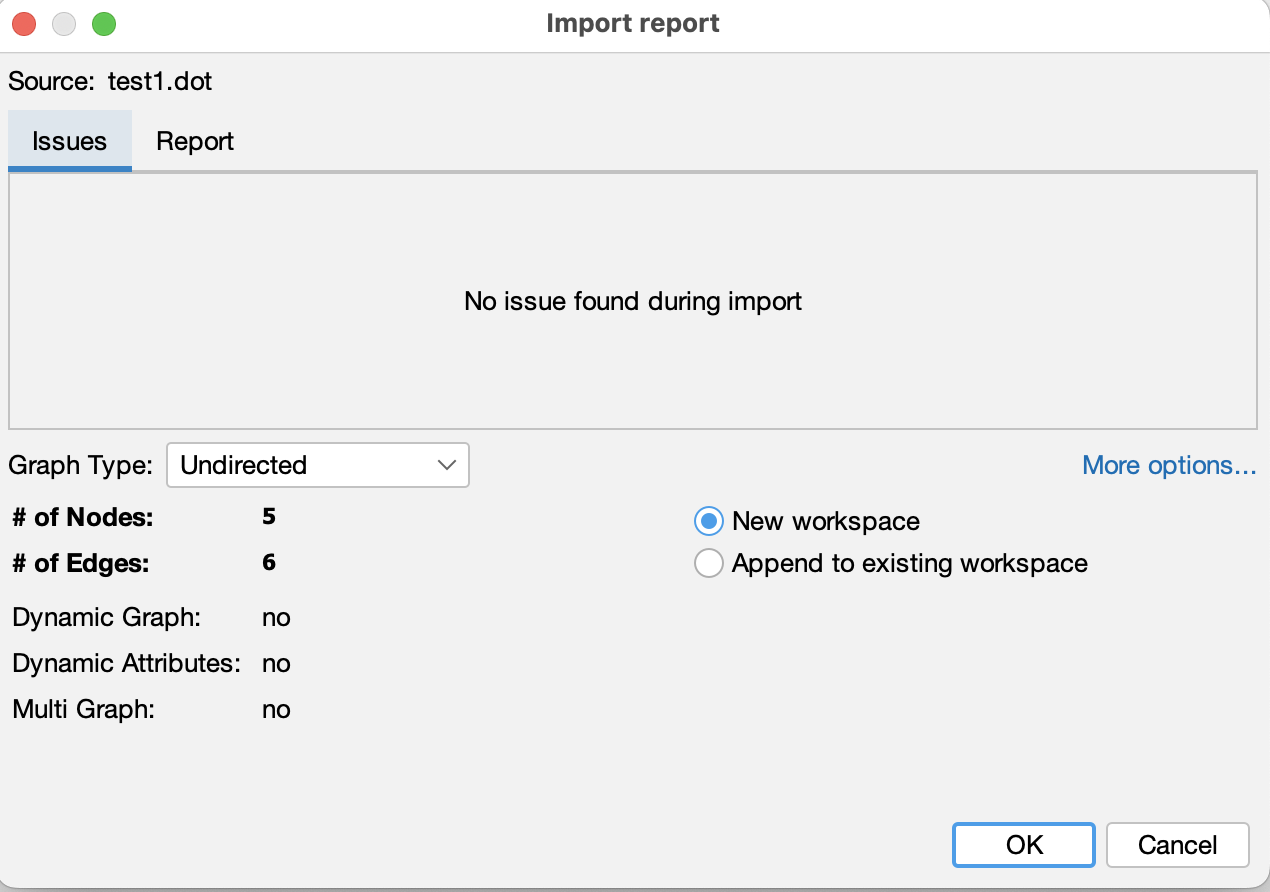
You can see that the hand-written file is an undiretecd graph with 5 nodes and 6 edges.
For Tuesday’s class, be prepared to interpret these simple numbers:
- What do these observations (numbers of edges and nodes in your graph) suggest about the text you examined?
- Are these observations consistent with other observations you’ve made about your text in other course work?